
On the morning of Thursday February 4, 2016 all faculty, staff and students were alerted to an emergency situation on Vancouver Island University’s Nanaimo campus. The alerts came through our desktop alerts system which provided information on the situation on screen and through an audible alert within campus buildings. When our office first heard the alert we thought to evacuate as that is the usual procedure for a common fire drill. However the alert for this issue specifically suggested we stay where we are. The specific message was “an emergency has been reported for the building. Please shelter in place and wait for further instructions. Unsafe conditions may exist outside. You will be notified when further information is available.”
My first thought was that this was a false alarm or drill, but since the message was quite different and suggested we seek shelter we did as we were told. I was in my office with two of my other colleagues who started to call around to gather more information. We quickly learned that there had been reports of an individual with a gun on our campus. Based on correspondence on the phone it was advised that we stay away from the windows and lock the doors.
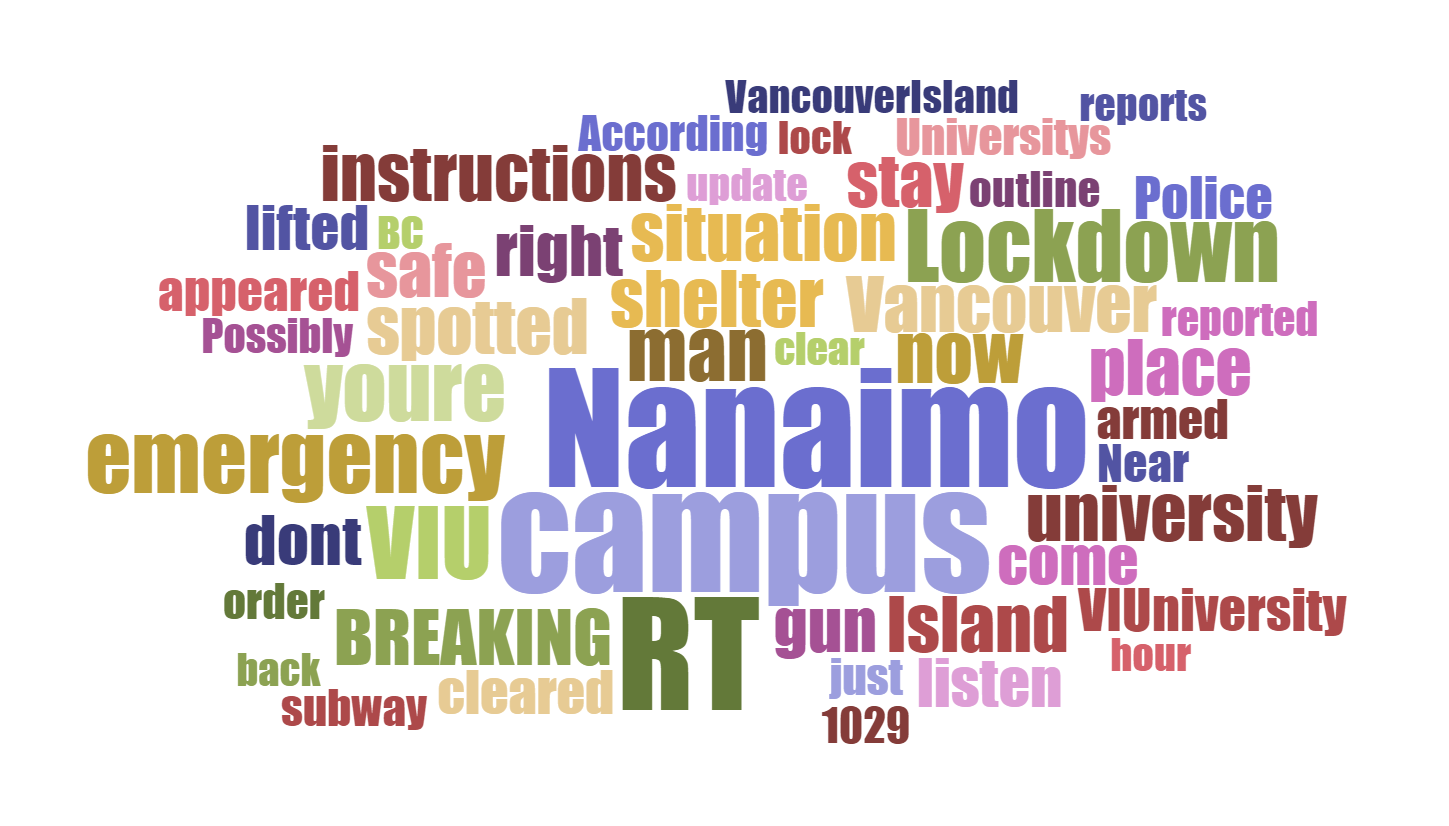
At this point I took to Twitter to explore what was being said about the event on social media. Various reports and messages related to the incident had begun popping up around the event from individuals on campus, local news media and around the world. With no other information coming from the alert system, Twitter became a source of up to the minute information about the incident. While none of the information generated could necessarily be validated, it did have the affect of raising awareness and keeping track of how the event was developing.
I have been archiving tweets on the #VIU hashtag for a couple years now. This involves setting up a script to query Twitter using the hashtag #VIU and copying those tweets to a spreadsheet every hour. If you are interested in doing this, I highly recommend the Tags service by Martin Hawksey which takes care of much of the technical work.
I extracted 358 individual tweets generated during roughly two hours from the start of the incident till the alert was lifted. The tweets were extracted based on querying the hashtags #VIU and #Nanaimo as well as the term “Vancouver Island University”. This limits the data to only updates which contain those terms, which in turn does limit the data set. I recognize that this method does not encompass all of the data created on Twitter about the event. In fact I had to manually add the @VIUniversity accounts data to the data set as many of the tweets during the incident did not include the search terms. This remains a significant challenge for running a social media analysis of an event like this, you either need to know your population of individuals who you want to analyze, or you need to know the hashtag or query which can be used to capture the conversation.
According to the data, the first indication of an issue was raised at around 10:41am by a staff member who received and shared the alert from their campus desktop.
Currently sheltering in place @VIUniversity due to unsafe conditions outside pic.twitter.com/cVk1i3aLXh
— Chris Alemany (@chrisalecanada) February 4, 2016
Shorty thereafter a similar tweet was generated on the official VIU Twitter account.
An emergency has been reported on Nanaimo Campus. Shelter in place until further notice.
— VIU (@VIUniversity) February 4, 2016
From this point information began to be further broadcast via retweets and new information was added by individuals on our campus. The graph below shows original tweets which meet the query detailed above as they came in over the two hours. A great deal of updates were generated during the 11:00 to 11:15am time as speculation around the incident were shared.
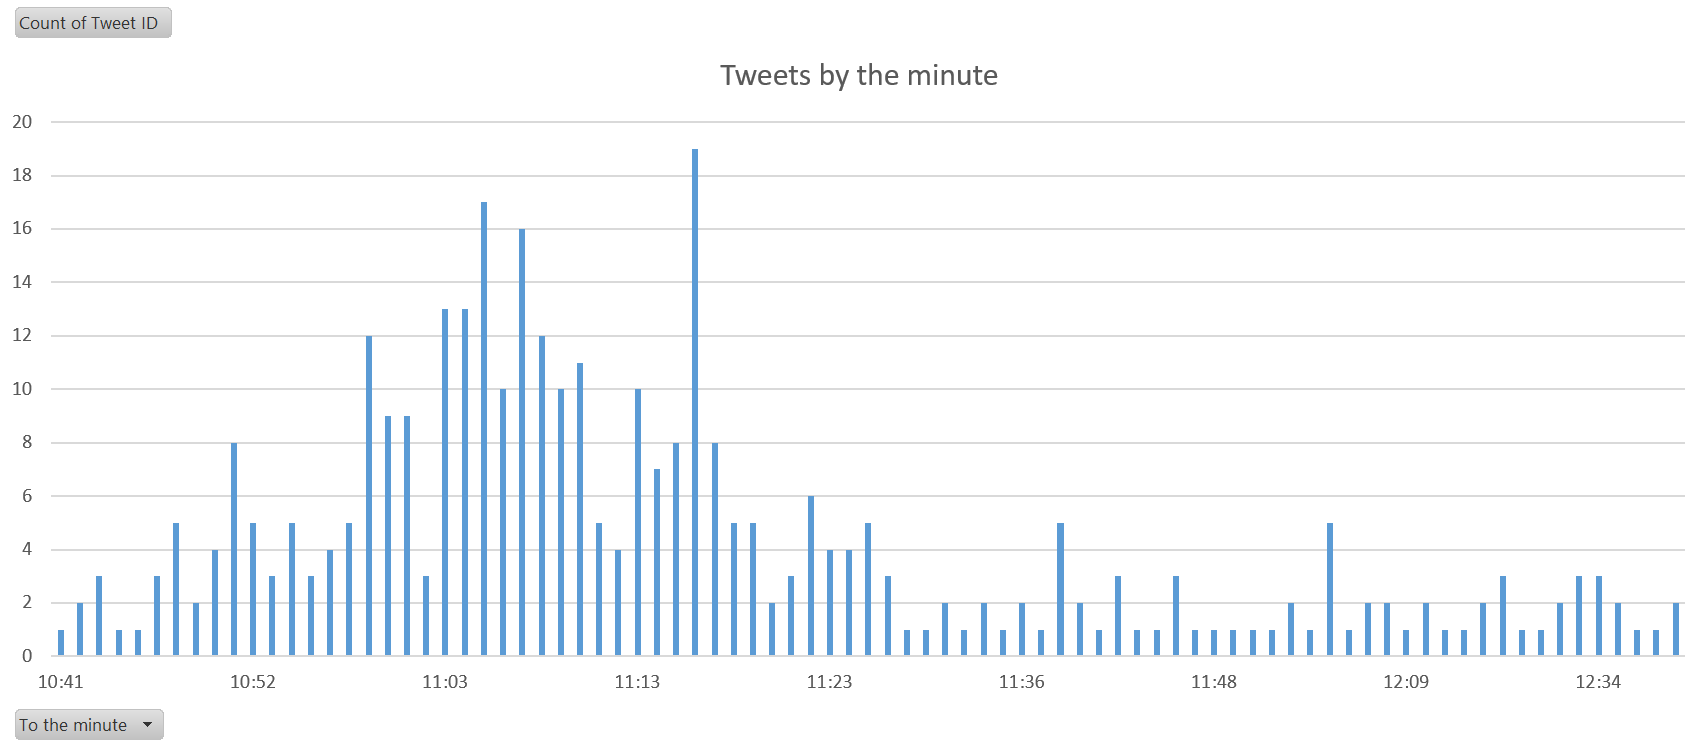
Tweets were generated from on campus, around Nanaimo, BC at large, across Canada and from as far away as the UK..
![CropperCapture[161]](http://michaelpaskevicius.com/wp-content/uploads/2016/02/CropperCapture161.png)
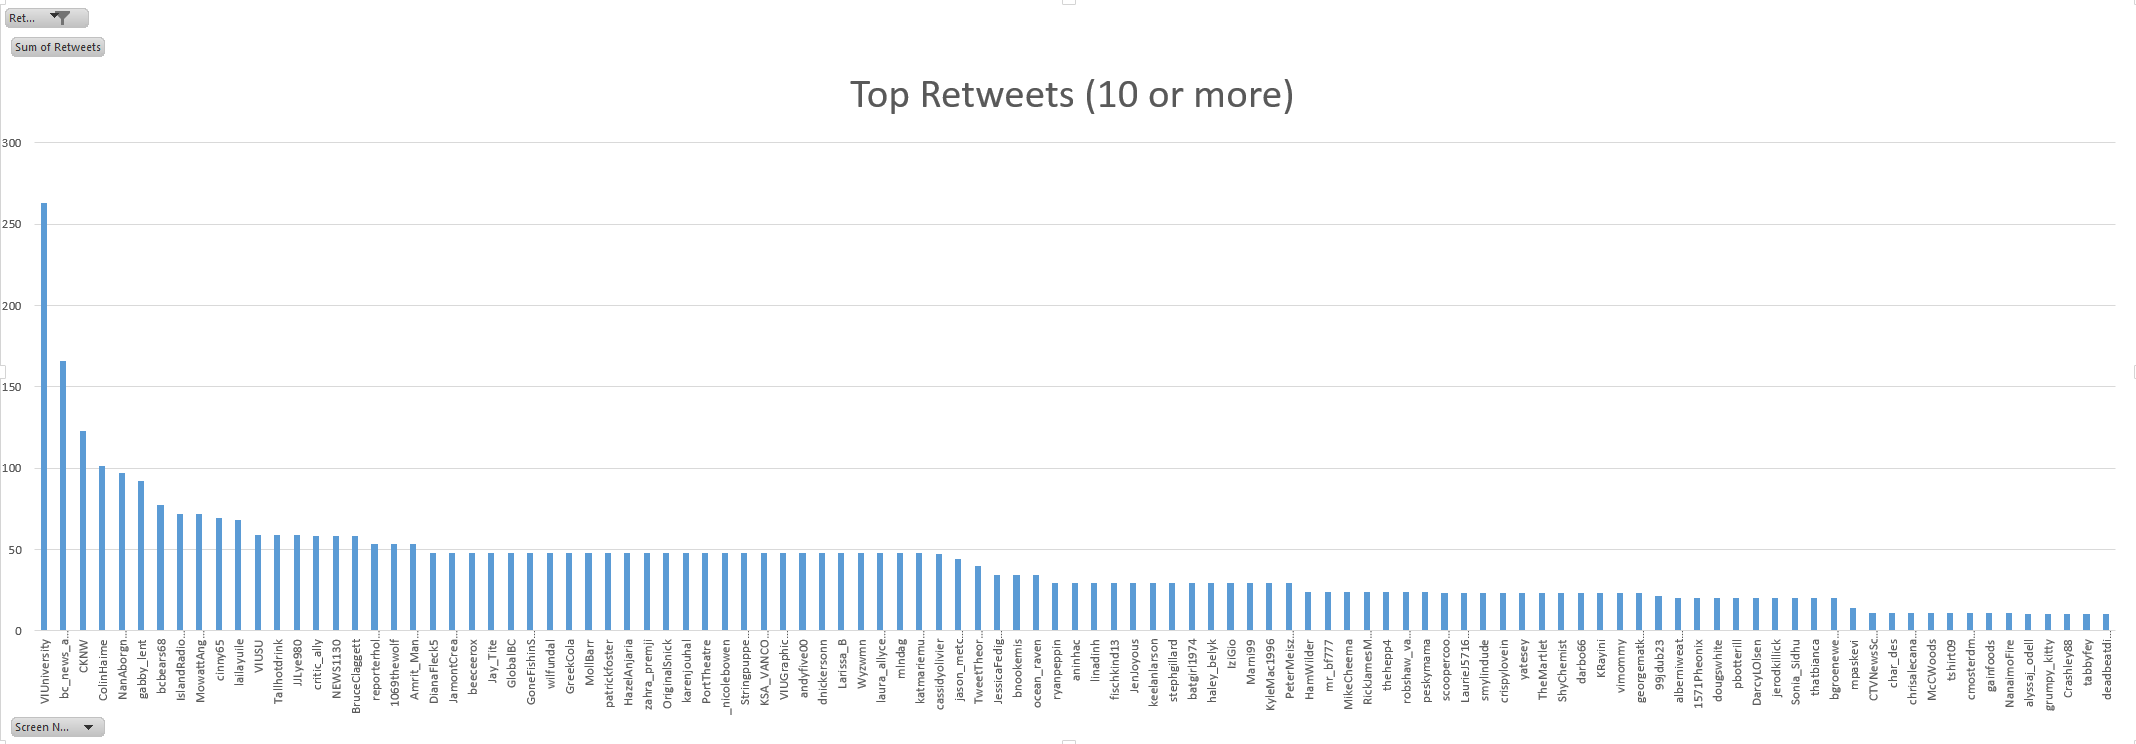
Top accounts for broadcasting the news of the situation can be identified through retweets. A retweet is basically a user repeating another persons’ tweet to their network of followers. The main VIUniversity account received the most retweets, most likely as it was regarded the most authoritative source for information during the incident.
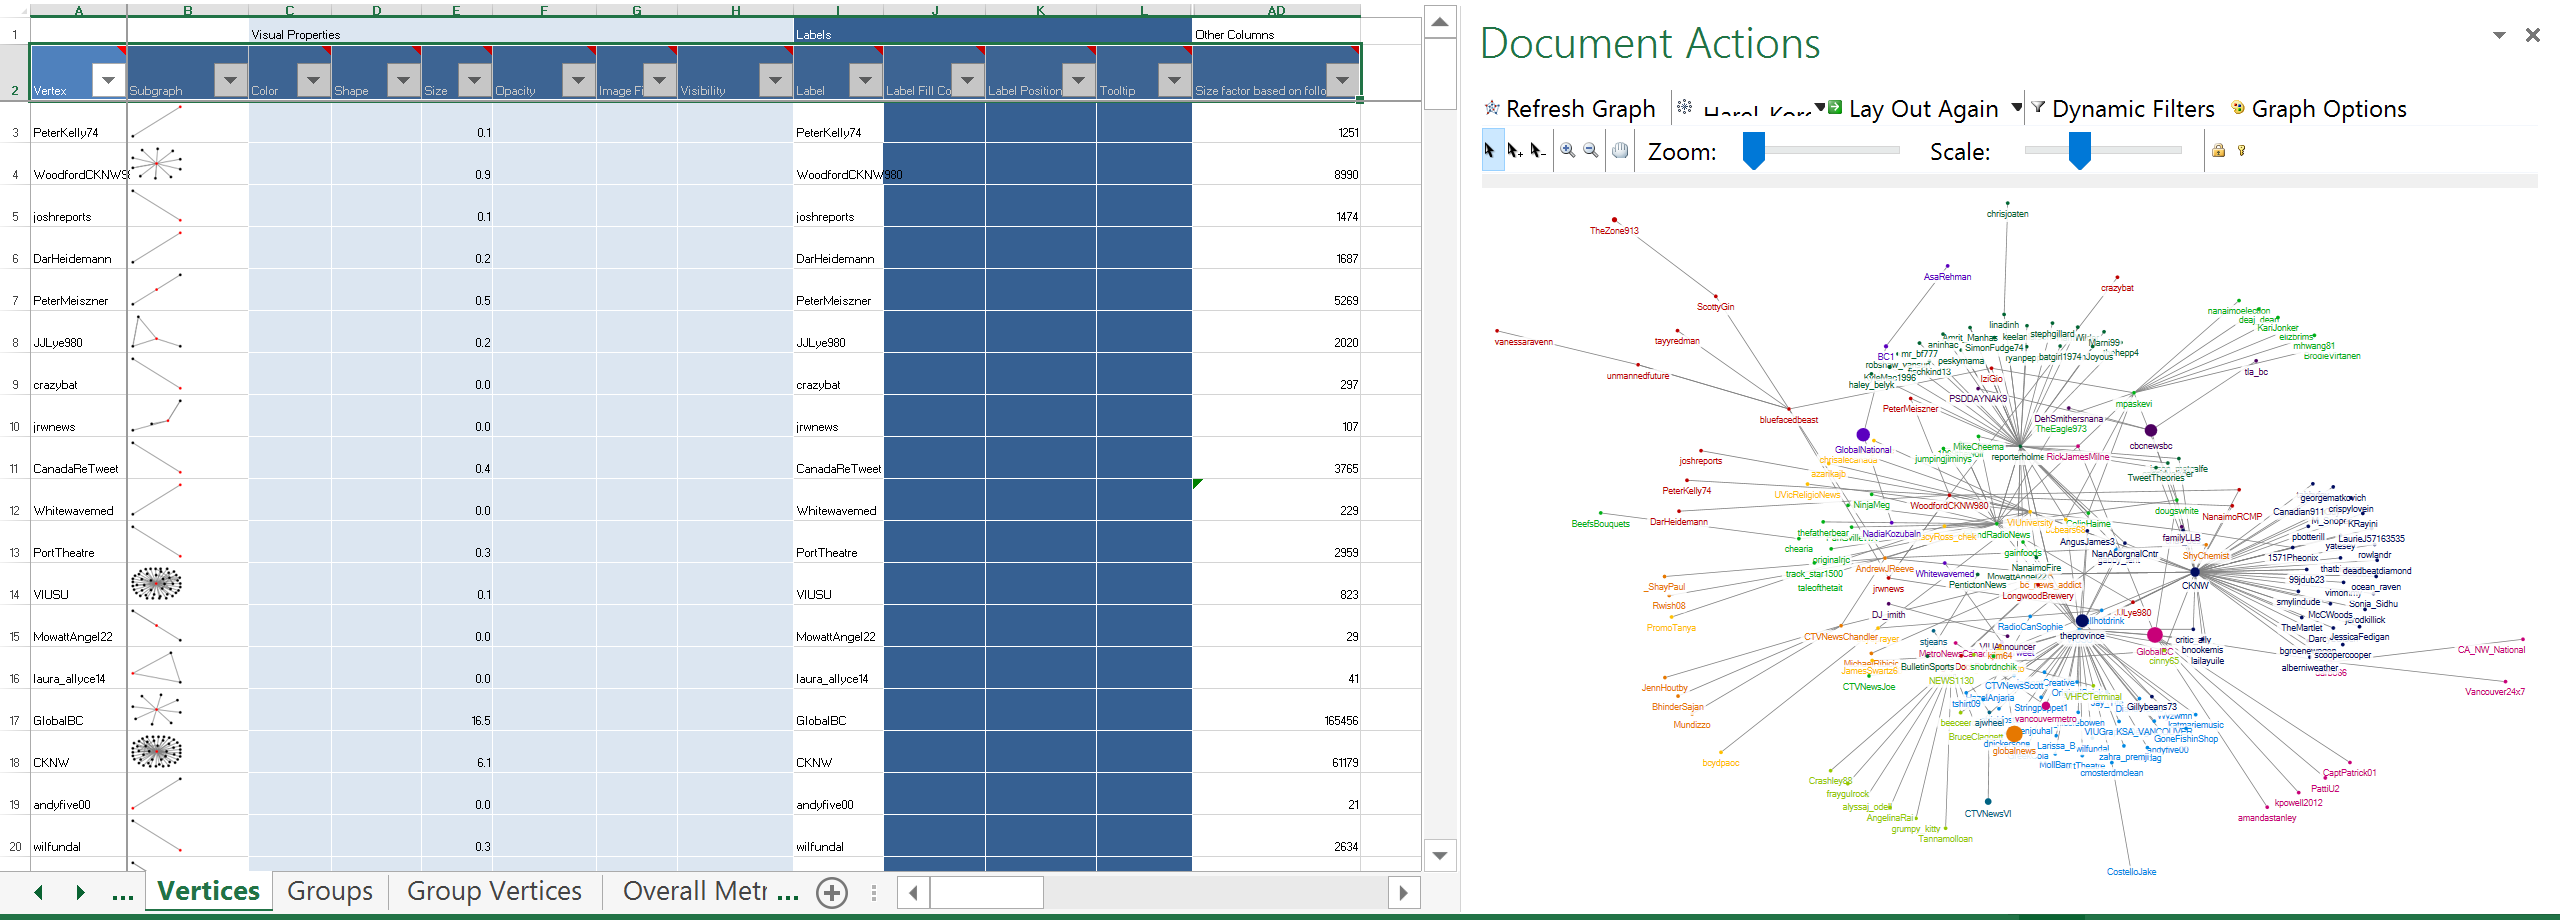
Retweets can be further visualized using social network analysis. Users are shown below as nodes connected by the edges which represent the relationships or interactions that connect them. This visualization is based upon the extracted tweets but the focus here is specifically on retweets, conversations between individuals, or user mentions. The graph shows nodes with the most diverse set of connections closer to the middle, with more isolated nodes at the periphery. The colours are applied to form groupings of the most connected individuals. The larger the node the more followers the account has. The larger nodes do appear to be more central and responsible for broadcasting but there are exceptions, for example reporterholmes who has fewer followers but generated quite a bit of interest.

These graphs are created with NodeXL a social media network analysis tool available as a free plugin for Excel which allows for the display and analysis of network graphs such as those which can be extracted from Twitter.
Twitter provides a significant source of data to understand how information spreads during an incident because it remains a popular social network and the content is openly available for analysis. I conducted a similar analysis in my last position when we had a helicopter crash land on our campus at the University of Cape Town. There is still much to be explored in this data set and I have really just shared these basic metrics for interest. If anyone wants to look closer at the data or explore further, feel free to leave a comment below.
References
Ahmed, W. (2015). Using Twitter as a data source: An overview of current social media research tools. London School of Economics Impact Blog, July 10th, 2015. http://blogs.lse.ac.uk/impactofsocialsciences/2015/07/10/social-media-research-tools-overview/
Anatomy of an Incident: Twitter Analysis of VIU Campus Emergency February 2016