
After writing a significant piece of work, I have in the past tried to create visualizations of the citation patterns within the writing. This may be done by drawing upon the citations in the literature and their linkages to sections of the paper or themes covered. I did this with my masters dissertation and it provided a quick view of how the works cited connected to my thesis. Beyond looking kind of neat, I think it also provides a way to quickly see patterns and connections within the corpus of literature used in a piece of writing.
If you are looking for a detailed description of how you can do this I have a blog post on extracting the citations, creating reference points for each citation, then visualizing those connections in NodeXL or other social network analysis (SNA) software.
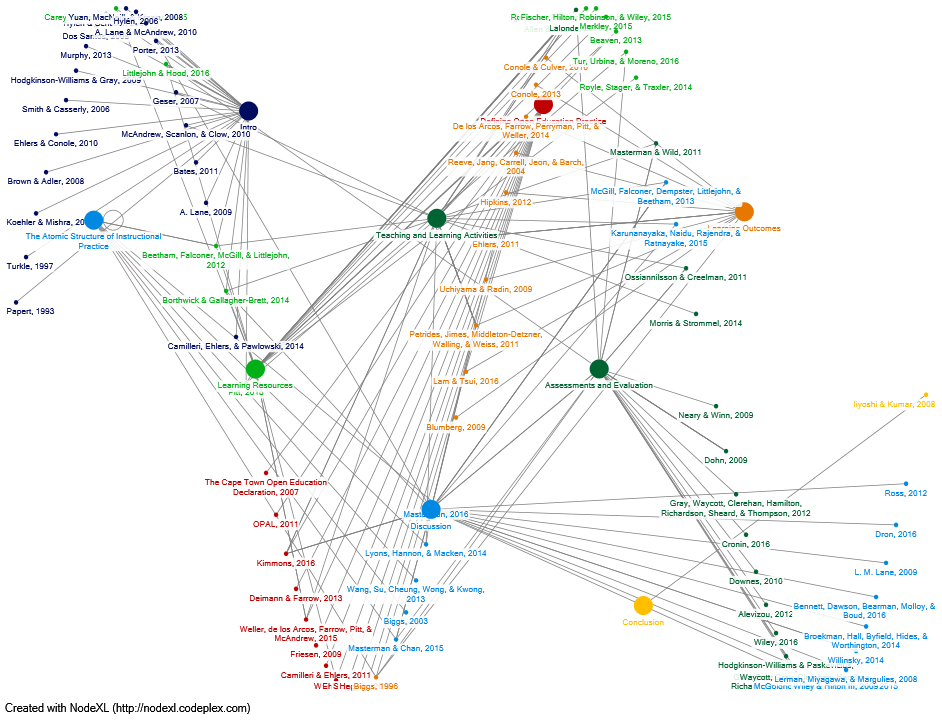
Upon completing my candidacy literature review, I ran a similar analysis on my paper to see what could be visualized. This first visual shows in text citations as they were referenced in sections of my paper. The large nodes shown here represent the sections, while the smaller nodes are the works cited. Each node appears only once and lines are drawn to represent the linkages between sections and citations.
We can also show the literature across a horizontal plane and map the connections to sections of the paper.
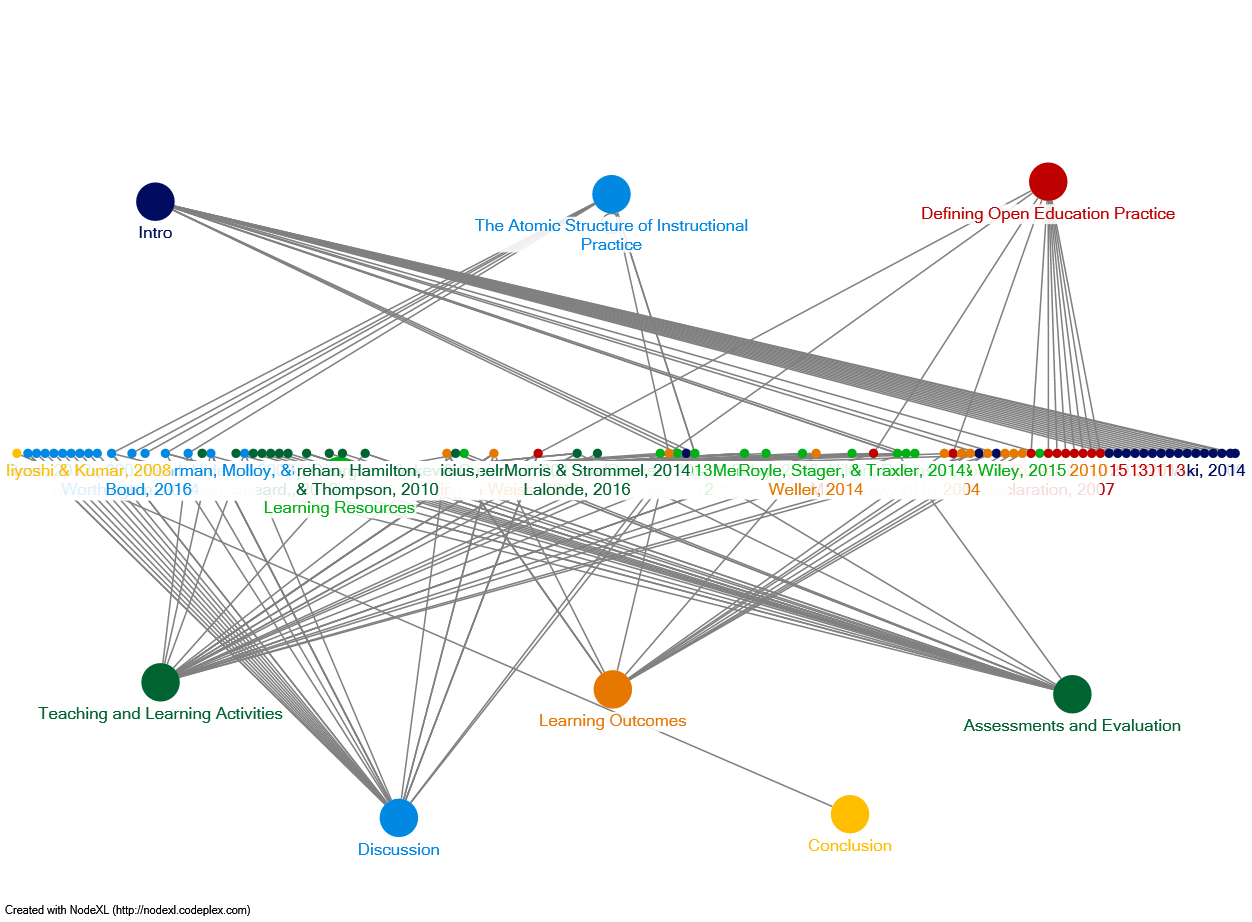
I believe this places the most often cited works in the middle of horizontal plane and the less cited works on the edges. This is helpful for me as it shows how the literature is connecting to multiple sections of the paper.
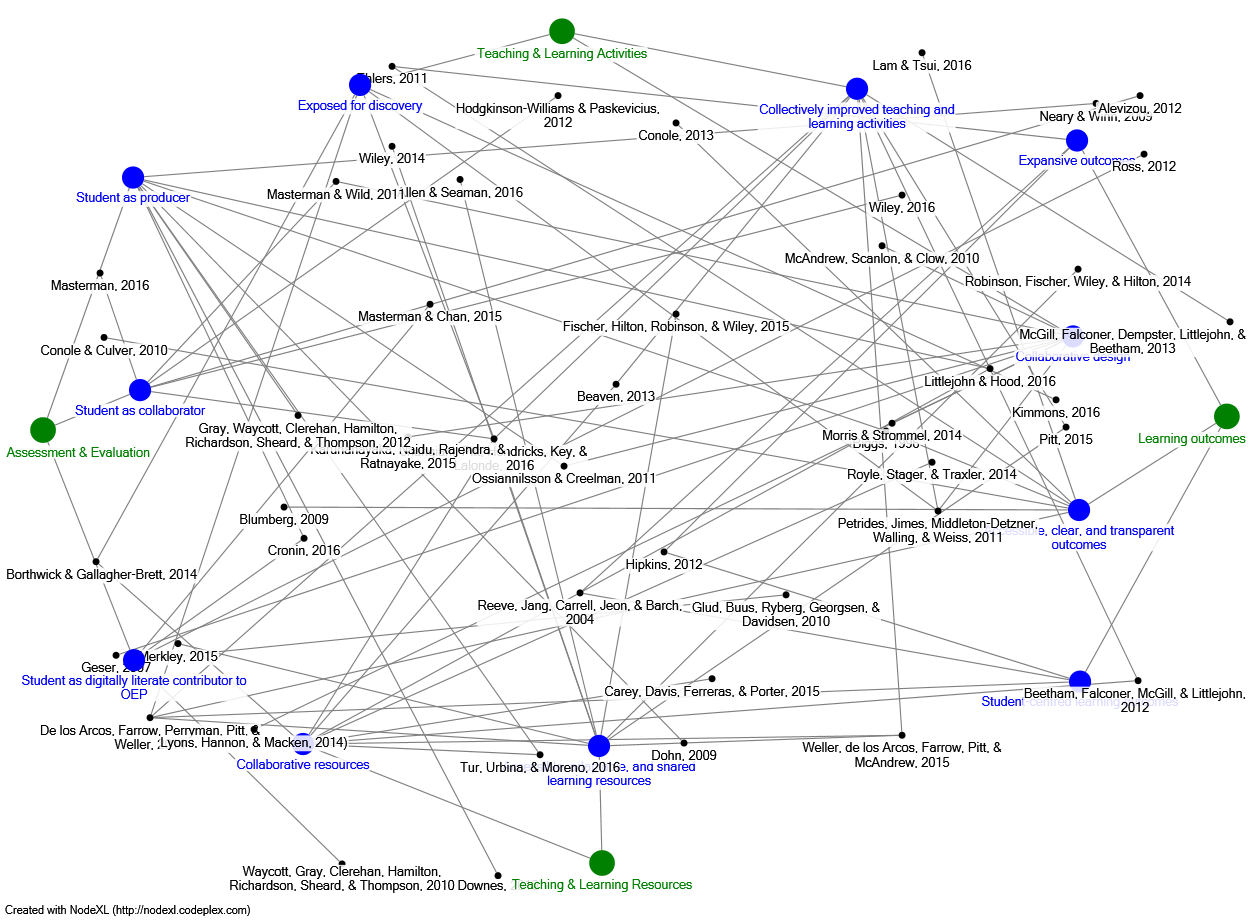
Beyond looking at sections of the paper, I further explored visualizing the literature and how it connected to themes identified in the paper. This takes some manual setup, as you have to extract the connections between citations and themes in the writing.
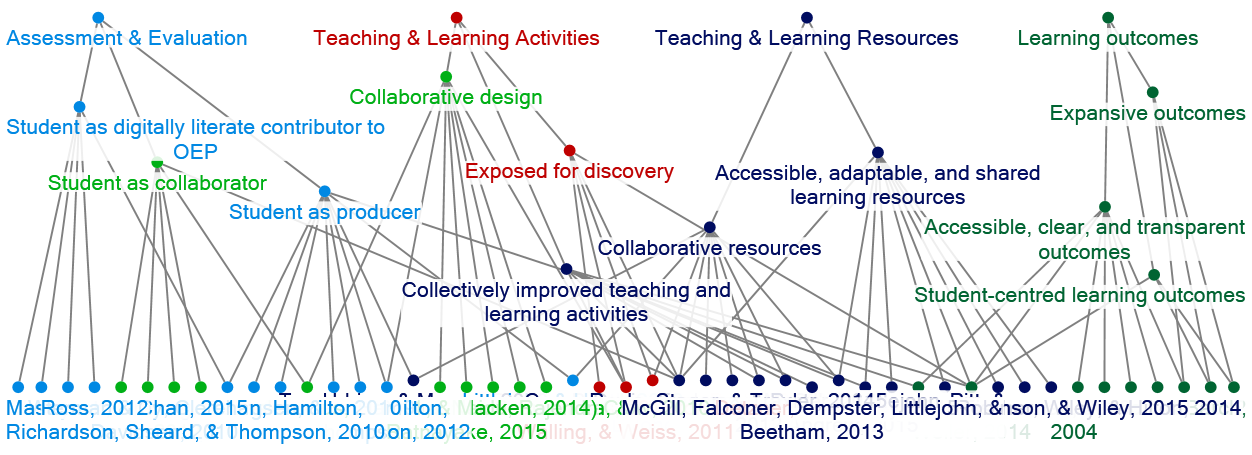
Another attempt to prepare this visualization can be to arrange the themes hierarchically around the outside of the graph, and plot the literature within.
Alternatively, these can be placed on a horizontal plane again to show the connections.

One of the challenges I have found with NodeXL is that the manual adjustment of node placement can be finicky. There is no way to prevent overlap of nodes, which would help considerably with readability when node labels are in use.
I moved my analysis of the themes in the literature to mind-mapping software to compensate for this. Although in doing so you lose the overlapping connections, as each reference to a citation is duplicated hierarchically instead of being uniquely mapped. My preferred mind-mapping tool is Coggle at the moment.
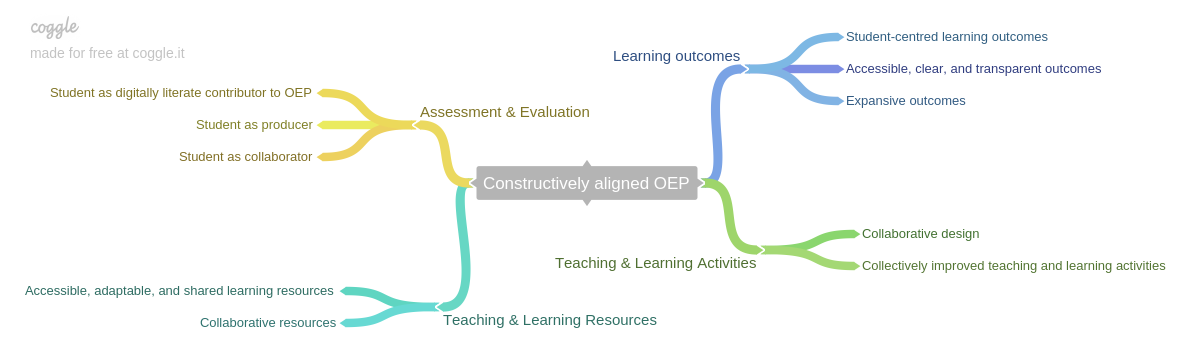
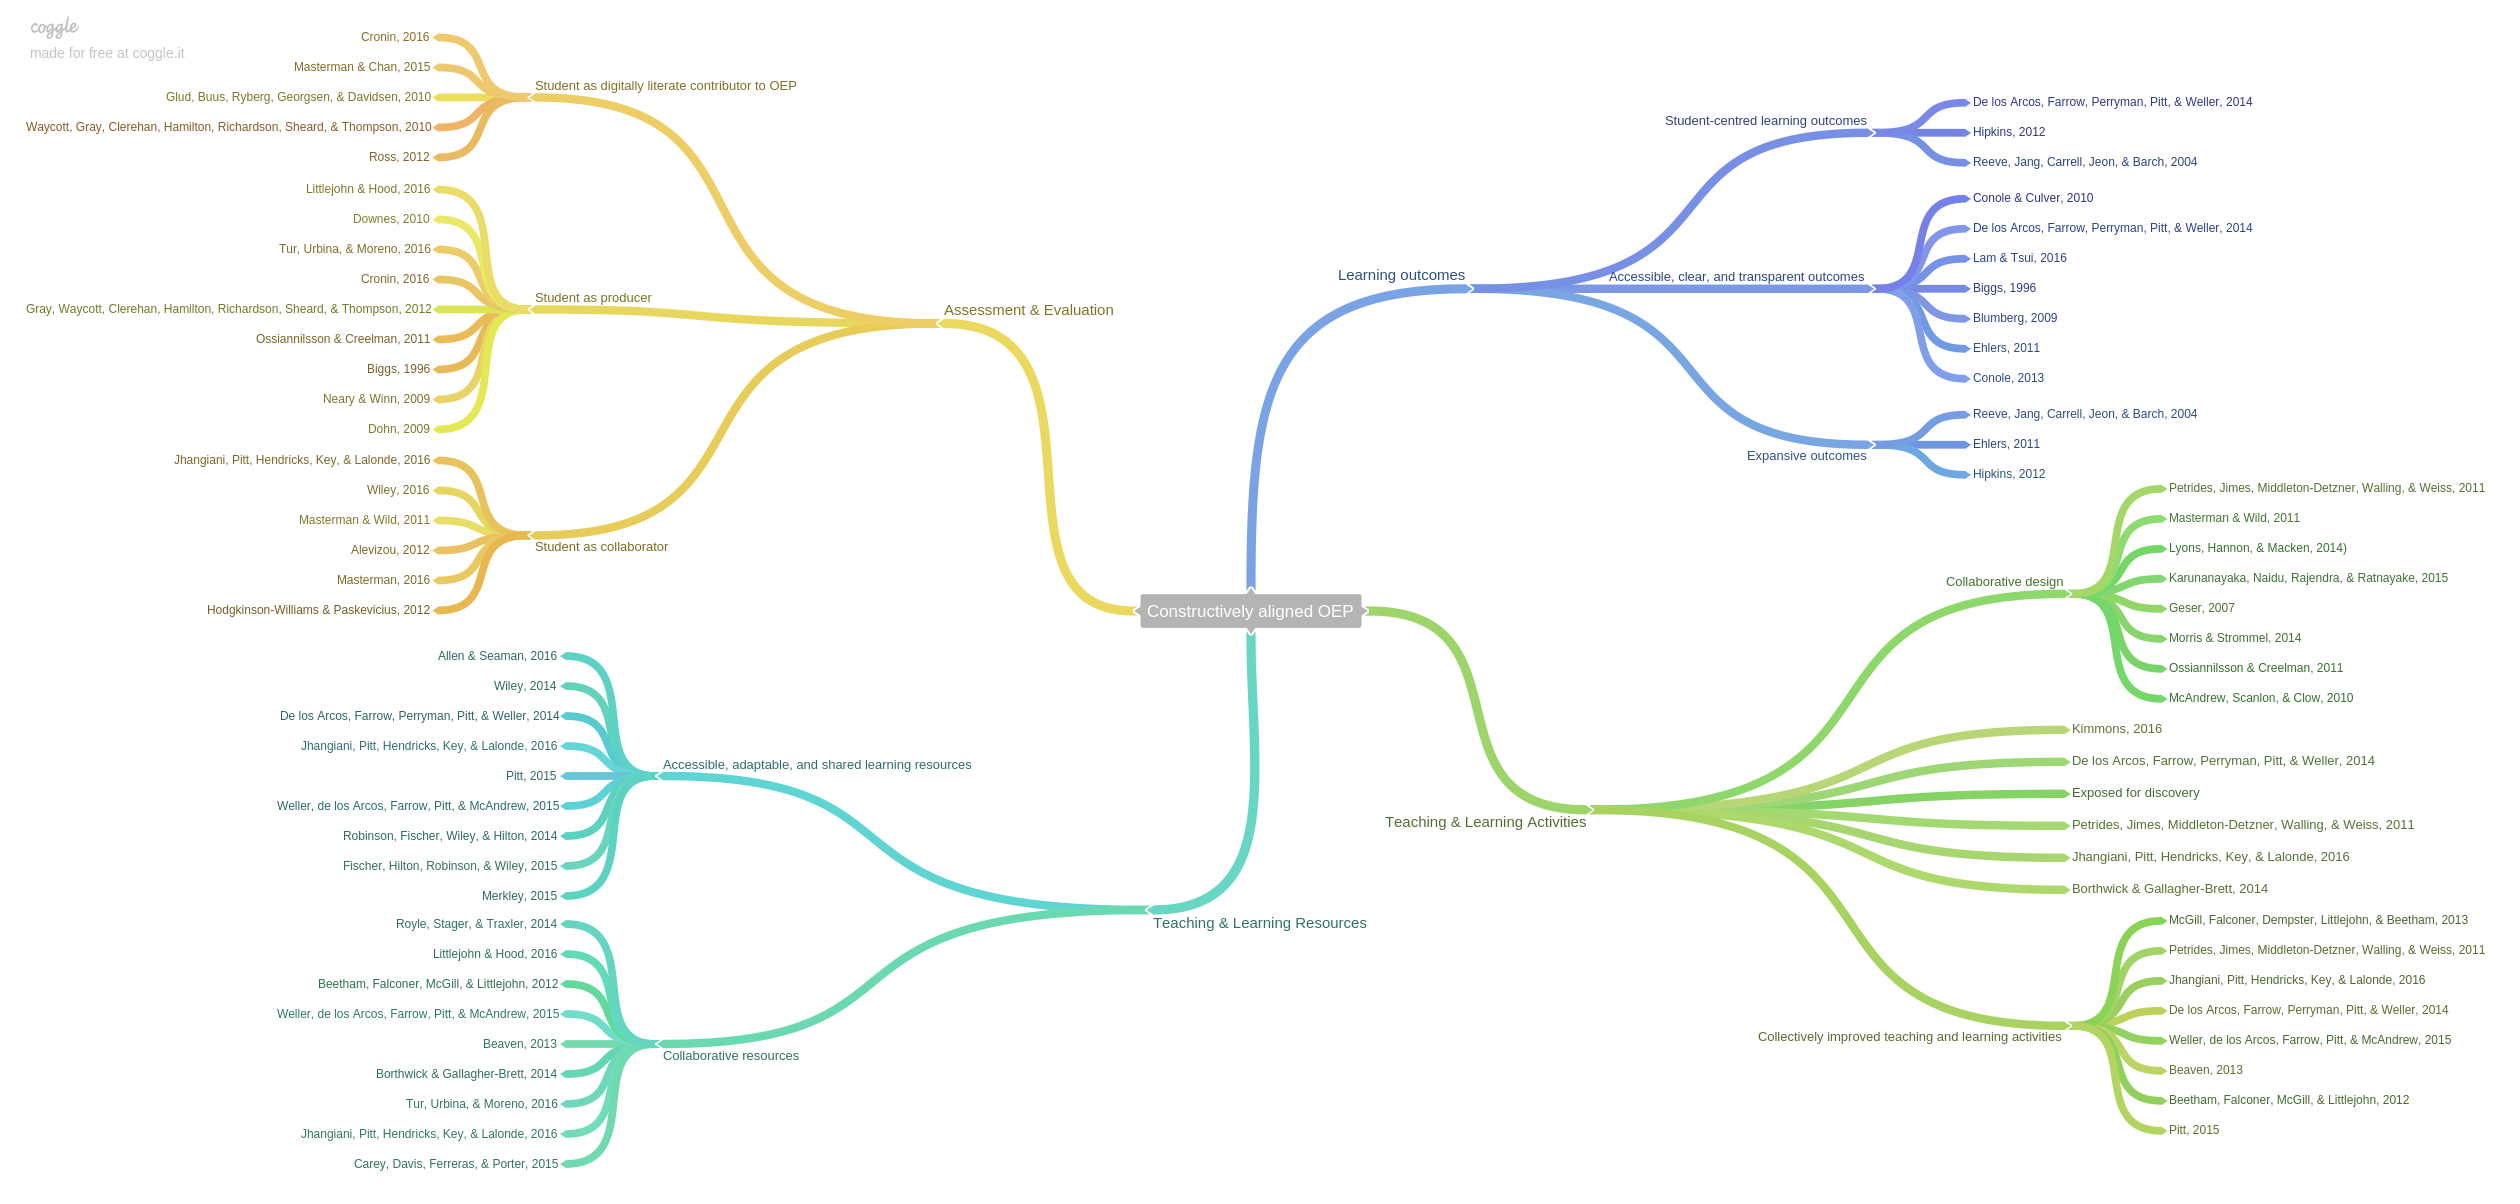
The first diagram above shows the themes and their connections. The diagram below then adds the literature which contributed to the themes.
If you want to explore this graphic I am happy to provide a link.
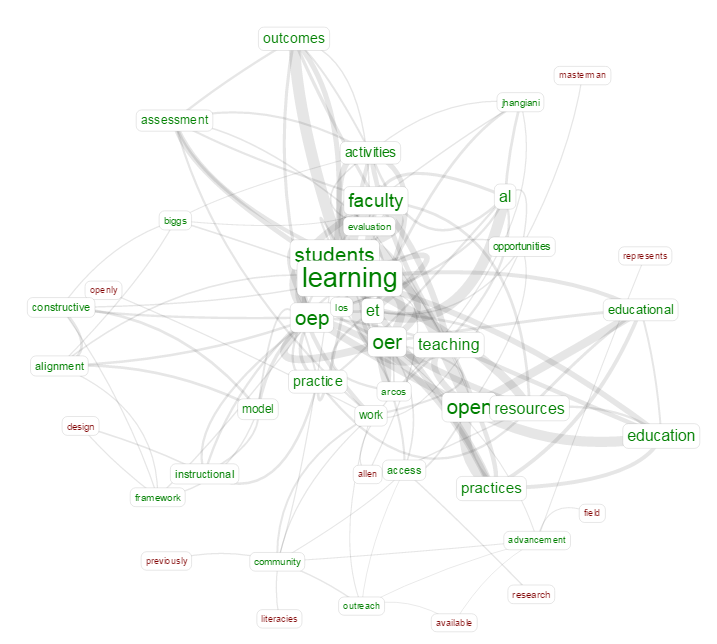
I have also started looking at online textual analysis software such as Voyant Tools and Textalyser (which appears to be down at the moment). Voyant Tools is a text reading and analysis environment which will expose patters in a body of text-based on built-in algorithms. It allows you to see common word combinations, patters of use throughout the document, and create word clouds based on the text. Voyant Tools provided the following linked word cloud visualization based on my paper.
I think these visualizations can be useful ways to engage with written works. As the author you can expose patterns emerging in your own writing and see how citations contribute to your argument. I did find it a valuable exercise to engage in while I was having my work reviewed by my committee and provided some interesting visualizations to discuss my paper.